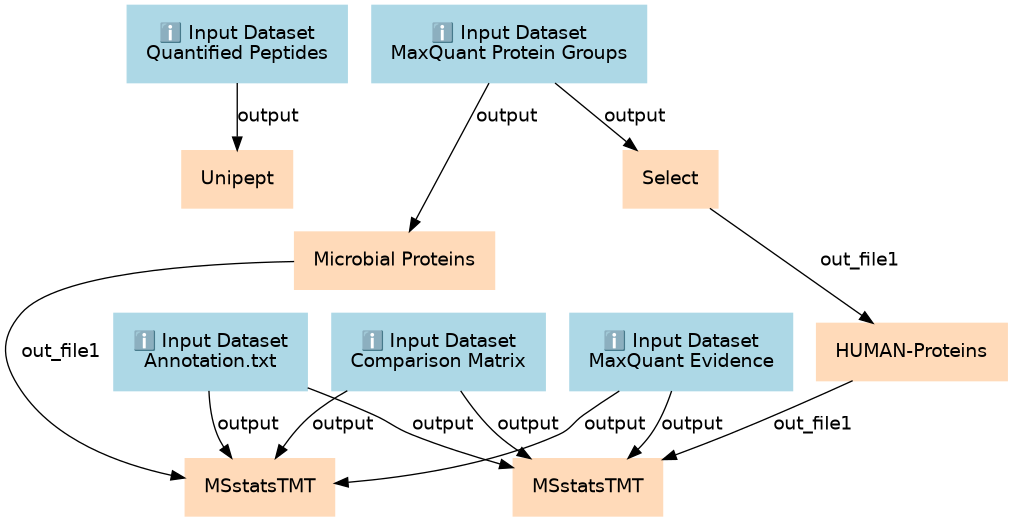
Workflow Type: Galaxy

Interpreting MaxQuant data using MSstats involves applying a rigorous statistical framework to glean meaningful insights from quantitative proteomic datasets
Associated Tutorial
This workflows is part of the tutorial Clinical Metaproteomics 5: Data Interpretation, available in the GTN
Thanks to...
Workflow Author(s): Subina Mehta
Tutorial Author(s): Subina Mehta, Katherine Do, Dechen Bhuming
Tutorial Contributor(s): Pratik Jagtap, Timothy J. Griffin, Bérénice Batut, Helena Rasche, Saskia Hiltemann, Björn Grüning, Subina Mehta
Inputs
| ID | Name | Description | Type |
|---|---|---|---|
| Annotation.txt | Annotation.txt | n/a |
|
| Comparison Matrix | Comparison Matrix | n/a |
|
| MaxQuant Evidence | MaxQuant Evidence | n/a |
|
| MaxQuant Protein Groups | MaxQuant Protein Groups | n/a |
|
| Quantified Peptides | Quantified Peptides | n/a |
|
Steps
| ID | Name | Description |
|---|---|---|
| 5 | Unipept | toolshed.g2.bx.psu.edu/repos/galaxyp/unipept/unipept/4.5.1 |
| 6 | Microbial Proteins | Grep1 |
| 7 | Select | Grep1 |
| 8 | MSstatsTMT | toolshed.g2.bx.psu.edu/repos/galaxyp/msstatstmt/msstatstmt/2.0.0+galaxy1 |
| 9 | HUMAN-Proteins | Grep1 |
| 10 | MSstatsTMT | toolshed.g2.bx.psu.edu/repos/galaxyp/msstatstmt/msstatstmt/2.0.0+galaxy1 |
Version History
 Creators and Submitter
Creators
Not specifiedSubmitter
Discussion Channel
Activity
Views: 1232 Downloads: 185 Runs: 0
Created: 2nd Jun 2025 at 10:53
 Tags
Tags Attributions
None
 Visit source
 Run on Galaxy
 master