
VIsoQLR main @ 9c6bc41
 View on GitHub
VIsoQLR: an interactive tool for the detection, quantification and fine-tuning of isoforms using long-read sequencing
VIsoQLR is an interactive analyzer, viewer and editor for the semi-automated identification and quantification of known and novel isoforms using long-read sequencing data. VIsoQLR is tailored to thoroughly analyze mRNA expression and maturation in low-throughput splicing assays. This tool takes sequences aligned to a reference, defines consensus splice sites, and quantifies isoforms. Users can edit splice sites through dynamic and interactive graphics and tables as part of their manual curation. Known transcripts, or isoforms detected by other methods, can also be imported as references for comparison.
A command line version is available at https://github.com/TBLabFJD/Mini-IsoQLR
Cite this article
To know more about VIsoQLR have a look at the article in Human Genetics: https://link.springer.com/article/10.1007/s00439-023-02539-z
Núñez-Moreno G, Tamayo A, Ruiz-Sánchez C, Cortón M, Mínguez P. VIsoQLR: an interactive tool for the detection, quantification and fine-tuning of isoforms in selected genes using long-read sequencing. Hum Genet. 2023 Mar 7. doi: 10.1007/s00439-023-02539-z. Epub ahead of print. PMID: 36881176.
Check our video tutorial
Developers
Main developers
- Gonzalo Núñez Moreno
Contact
- Gonzalo Núñez Moreno ([email protected])
License
Mini-IsoQLR source code is provided under the Creative Commons Attribution-NonCommercial-ShareAlike 4.0 International (CC BY-NC-SA 4.0). Mini-IsoQLR includes several third party packages provided under other open source licenses, please check them for additional details.
Installation
VIsoQLR has been wrapped into a Docker image. To set it up:
- Install Docker following the instructions in https://www.docker.com/. Docker is available for Linux, Windows and Mac users. For windows users, as the image has been developed for Linux kernel, it is necessary to install Linux on Windows with WSL2 (Windows Subsystem for Linux) following the instructions in https://learn.microsoft.com/en-us/windows/wsl/install.
- Once installed type on your shell (or Windows PowerShell in Windows once Docker Desktop has been initialized):
This will download the latest version of VIsoQLR image. This image has already all programs, packages and requirements needed to run VIsoQLRdocker pull tblabfjd/visoqlr:latest
Run VIsoQLR
To run VIsoQLR type on your shell (or Windows PowerShell in Windows once Docker Desktop has been initialized):
docker run -it -p 8888:8888 tblabfjd/visoqlr:latest
This will display some text on the shell and once the line Listening on http://0.0.0.0:8888 appears go to the browser and type http://0.0.0.0:8888 on Linux systems or http://localhost:8888 on Windows systems. If successful you will see:

Click on 'Browse...' button to navigate to your file system to upload your aligner reads in GFF3, BED6, or BAM file format. Once selected the program will automatically run with its default parameters to identify and quantify isoforms. and you will see something like this:

Features
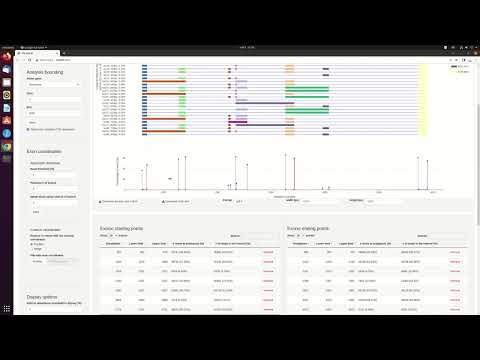
Analysis bounding: this panel allows the user to change the analyzed gene and/or the region of study. Mapped regions outside the selected region will be ignored. This can be used to focus the analysis in a section of the gene.Exon coordinates: Automatic detection: This panel contains three parameters used for the automatic detection of consensus exon coordinates (CECs). TheRead threshold (%)is used to select candidate CECs above this value based on the proportion exon coordinates among all reads. ThePadding (# of bases)are the number of bases at each side of a candidate CES where other non-candidate CEC (below range in the frequency filter) are merged. TheMerge close splice sites (# of bases)is used to merger candidate CESs into the most frequent one if they are closer than the given distanceExon coordinates: Custom coordinates: This panel allow the user to uploaded known or previously defined splice sites to replace or merge with the existing ones. This accepts as an input the exon coordinate file that can be downloaded from the Exonic starting/ending points panel.Display options: allows you to modify the aspect and number of elements of the plotDefined isoforms for comparison: This panel allows you to uploaded transcripts for visual comparison.- Figure panel: the figure is rendered using Plotly which allows the user to zoom in and move through the figure. The color code is used to identify identical exons. Below isoforms, the frequency of start (blue) and end (red) coordinates are shown. The consensus exon coordinates (CECs) are marked with a dot on each bar, and the exact coordinate and frequency are displayed with the cursor over. It is possible to download a screenshot of what is displayed at the moment by clicking the camera icon in the top-right corner. It is also possible to download the whole figure in a dynamic plot (in HTML) and static plot in multiple formats.
- Exonic starting/ending points panel: Editable table where the user can add, delete and modify CECs.
- Isoform information panel: Table which provides extra isoform information.
- Exon information panel: Table which provides extra exon information.
Run sequence alignment using VIsoQLR
One initiated click on "Mapping" in the top-left. You should see something like:
 The screen is divided in 3 panels. The first one is used to build the reference index used by GMAP by uploading the reference sequence(s). Once you upload your sequence(s) the index building will start automatically. Once is complete, a download bottom will appear on the screen. The second panel is dedicated to align the raw reads (in FASTQ format) using GMAP. To do so, upload the ZIP file downloaded from the previous panel as the reference index, the FASTQ file, chose the number of threads and click
 Run mapping. Once the reads alignment is done, a download bottom will appear to retrieve the mapped sequences. In case of selecting the BAM option as an output, two download bottoms will appear: the mapped reads (BAM) and its index (BAI). The BAI file is require, for example, to upload the BAM file in IGV. The last column performs the alignment using Minimap2. In this case the reference must be in FASTA format (the same file used to build the GMAP index in the first panel). Although two major solutions for the alignment are made available, we recommend using GMAP as Minimap2 has problem aligning small exons. This limitation is advised in their GitHub (https://github.com/lh3/minimap2), in the “Limitations” section.
Version History
main @ 9c6bc41 (earliest) Created 12th Aug 2025 at 13:48 by Yolanda Benítez Quesada
article link
Frozen
 main
main9c6bc41
 Creators and Submitter
Views: 1379 Downloads: 312
Created: 12th Aug 2025 at 13:48
AttributionsNone
Related items

A space managed by WorkflowHub administrators for teams that don't want/need to manage their own space.
Teams: IBISBA Workflows, NMR Workflow, UNLOCK, NanoGalaxy, Galaxy Climate, PNDB, IMBforge, COVID-19 PubSeq: Public SARS-CoV-2 Sequence Resource, LBI-RUD, Nick-test-team, Italy-Covid-data-Portal, UX trial team, Integrated and Urban Plant Pathology Laboratory, SARS-CoV-2 Data Hubs, lmjxteam2, virAnnot pipeline, Ay Lab, iPC: individualizedPaediatricCure, Harkany Lab, MOLGENIS, EJPRD WP13 case-studies workflows, Common Workflow Language (CWL) community, Testing, SeBiMER, IAA-CSIC, MAB - ATGC, Probabilistic graphical models, GenX, Snakemake-Workflows, ODA, IPK BIT, CO2MICS Lab, FAME, CHU Limoges - UF9481 Bioinformatique / CNR Herpesvirus, Quadram Institute Bioscience - Bioinformatics, HecatombDevelopment, Institute of Human Genetics, Testing RO Crates, Test Team, Applied Computational Biology at IEG/HMGU, INFRAFRONTIER workflows, OME, TransBioNet, OpenEBench, Bioinformatics and Biostatistics (BIO2 ) Core, VIB Bioinformatics Core, CRC Cohort, ICAN, MustafaVoh, Single Cell Unit, CO-Graph, emo-bon, TestEMBL-EBIOntology, CINECA, Toxicology community, Pitagora-Network, Workflows Australia, Medizinisches Proteom-Center, Medical Bioinformatics, AGRF BIO, EU-Openscreen, X-omics, ELIXIR Belgium, URGI, Size Inc, GA-VirReport Team, The Boucher Lab, Air Quality Prediction, pyiron, CAPSID, Edinburgh Genomics, Defragmentation TS, NBIS, Phytoplankton Analysis, Seq4AMR, Workflow registry test, Read2Map, SKM3, ParslRNA-Seq: an efficient and scalable RNAseq analysis workflow for studies of differentiated gene expression, de.NBI Cloud, Meta-NanoSim, ILVO Plant Health, EMERGEN-BIOINFO, KircherLab, Apis-wings, BCCM_ULC, Dessimoz Lab, TRON gGmbH, GEMS at MLZ, Computational Science at HZDR, Big data in biomedicine, TRE-FX, MISTIC, Guigó lab, Statistical genetics, Delineating Regions-of-interest for Mass Spectrometry Imaging by Multimodally Corroborated Spatial Segmentation, OLCF-WES, Bioinformatics Unit @ CRG, Bioinformatics Innovation Lab, BSC-CES, ELIXIR Proteomics, Black Ochre Data Labs, Zavolan Lab, Metabolomics-Reproducibility, Team Cardio, NGFF Tools, Bioinformatics workflows for life science, Workflows for geographic science, Pacific-deep-sea-sponges-microbiome, CSFG, SNAKE, Katdetectr, INFRAFRONTIER GmbH, PerMedCoE, Euro-BioImaging, EOSC-Life WP3 OC Team, cross RI project, ANSES-Ploufragan, SANBI Pathogen Bioinformatics, Biodata Analysis Group, DeSci Labs, Erasmus MC - Viroscience Bioinformatics, ARA-dev, Mendel Centre for Plant Genomics and Proteomics, Metagenomic tools, WorkflowEng, Polygenic Score Catalog, bpm, scNTImpute, Systems Biotechnology laboratory, Cimorgh IT solutions, MLme: Machine Learning Made Easy, Hurwitz Lab, Dioscuri TDA, Scipion CNB, System Biotechnology laboratory, yPublish - Bioinfo tools, NIH CFDE Playbook Workflow Partnership, MMV-Lab, EMBL-Bioimage Analysis Support, EBP-Nor, Evaluation of Swin Transformer and knowledge transfer for denoising of super-resolution structured illumination microscopy data, Bioinformatics Laboratory for Genomics and Biodiversity (LBGB), multi-analysis dFC, CholGen, RNA group, Plant Genomes Pipelines in Galaxy, Pathogen Genomic Laboratory, Chemical Data Lab, JiangLab, Pangenome database project, HP2NET - Framework for construction of phylogenetic networks on High Performance Computing (HPC) environment, Center for Open Bioimage Analysis, Generalized Open-Source Workflows for Atomistic Molecular Dynamics Simulations of Viral Helicases, Historical DNA genome skimming, QCDIS, Peter Menzel's Team, NHM Clark group, ESRF Workflow System (Ewoks), Kalbe Bioinformatics, Nextflow4Metabolomics, GBCS, CEMCOF, Jackson Laboratory NGS-Ops, Schwartz Lab, BRAIN - Biomedical Research on Adult Intracranial Neoplasms, Cancer Therapeutics and Drug Safety, Deepdefense, Mid-Ohio Regional Planning Commission, MGSSB, Institute for Human Genetics and Genomic Medicine Aachen, FengTaoSMU, EGA, Plant-Food-Research-Open, KrauthammerLab, Geo Workflows, grassland pDT, FunGIALab, CRIM - Computer Research Institute of Montréal, Medvedeva Lab, Metagenlab, FAIR-EASE, Protein-protein and protein-nucleic acid binding site prediction research, Culhane Lab, IDUN - Drug Delivery and Sensing, Edge Computing DAG Task Scheduling Research Group, Stratum corneum nanotexture feature detection using deep learning and spatial analysis: a non-invasive tool for skin barrier assessment, COPO, Taudière group, ErasmusMC Clinical Bioinformatics, interTwin, fluid flow modeling, EnrichDO, WorkflowResearch, Application Security - Test Crypt4GH solutions, RenLabBioinformatics, Yongxin's team, PiFlow, HLee_SeoGroup, UFZ - Image Data Management and Processing Workflows, Korean Bioinformaticians, Into the deep, XChem, CPM, SocialGene, Research Data Management ICE-2, ObjectRecognition, LiDAR, FONDA II C2, Astroparticle Lab, FAIRagro M4.4, Kgerring, QuackenbushLab, Virus sequencing team, SOS, BioImage Informatics and Analysis Workflows, BoostNano, simblockflow, CSSB, Research on Workflow scheduling, Research Data1, CSUbioinformatics, CDPP, Mr., ASD-HRS, data management, FAIR_thesis: Marine acoustic data, CellBinDB, DEEP Lab, University of Amsterdam, SIMEXP, nf-pediatric Team, Kasmanas, Structural Variation Analysis, fuzzyworkflow, CausalCoxMGM Team, Tufts University Center for Cellular Agriculture (TUCCA), Test, CrustyBase, Applied Computational Cancer Research, Click-qPCR, BAID Team, FabianLab, Vector informatics and genomics group, AlmondBreedingLab, Artificial Design for Intelligent Breeding, ELIXIR Biodiversity Community, GROTIA, Biomedical_LLM, WhiteSymmetry, Hämatologie Labor Kiel, pakbaba, Metagenomics Analysis, MTB Bioinformatics Workflows, RTC Bioinformatics, CMG-GUTS, EI Papatheodorou Group, Metagenomics Analysis of Microbiome, ColoPola: A polarimetric imaging dataset for colorectal cancer detection, AI in Zhou Lab, CEPLAS, LTER-Italy, Gevaert Lab, Kendall-Theisen lab pipelines, High Performance Scientific Computing Laboratory (HPSC), Ensembl Metazoa and Plants, BiRD, Q-Dawn, AMRMALDI, Systems and Synthetic Biology, EI Core Bioinformatics Group, Values Shape Community, SolutionMake, GENEX, iPol, zxfenglab, Bioinformatics Unit IIS-FJD, omnibenchmark, BioX Fanatics, Li-Omics Lab, Metro Team, ZiemertLab, Song Lab, PanGIA, Holobionts Workflows, An Ideal Design for RNA-seq investigations into RPL, AMI2B Team, Institute for Hearing Technology and Acoustics (IHTA), Transcriptomics in unexplained recurrent pregnancy loss, E-MOBI / EKONOMIK MOBIL,S.R.L, Workflow Run Crate working group, datafun, BioFAIR, BH2025_Project30, NII Test Team, LIB, Galaxy and Beyond, Biodepot Spatial Proteomics Team, WEHI SODA Hub, Digital Platform, Anesthesia and Neurocritical Care Medicine, Digital Skills in Arts and Humanities, BioimageAIpub, Dalmolin Systems Biology Group, FAIRMD, KG-Microbe, BGIQD, CSB, EMRS, BioImagingUK, Bachelor Thesis Developeming an Algorithm for the Generation of Synthetic Scientific Workflows and Characterization of the generated Workflows, GenotoulBioinfo, mzlab, Liver Polyploidy Research Team, Computational Metabolomics (UoB), UiT-CANS, PathoFact2, Polyploid Spatial Transcriptomics Team, CCBR, FONDA T9 Project Team, Cen Occitanie's Geomateam, Exeter Genetics, HP-Phasing, CPSM, Bayrak Lab, Eco-Flow, oceanbase, Proj Renzo, UFZ Galaxy workflows, CEIT-Metaverse, EnChemTox, Tesla, FHAIVE - Finnish Hub for Development and Validation of Integrated Approaches, ZhuLab MII Group, Protea Glycosciences Analytical, Immunodynamics-Engel-Lab, NanoporeDB, SyBR Development, Membrane Protein-Lipid Interaction Database Pipeline, Grunwald Lab, SensorWF, Chocot test team, UNSW MWAC Structural Biology Facility, ELIXIR Norway, EMBL Hentze Group, ConesaLab, AdLab, INP-SDT, FAIRagro, UnB-CompGen, Mitra Lab
Web page: Not specified
Bioinformatics Unit of the Health Research Institute Fundación Jiménez Díaz (IIS-FJD).
Space: Independent Teams
Public web page: https://www.translationalbioinformaticslab.es/